This tab shows all of the patient's arrhythmia episodes since their device implantation.
It displays:
- A graph that plots the arrhythmic episodes against the programmed zones of the cardiac device (the time period is adjustable).
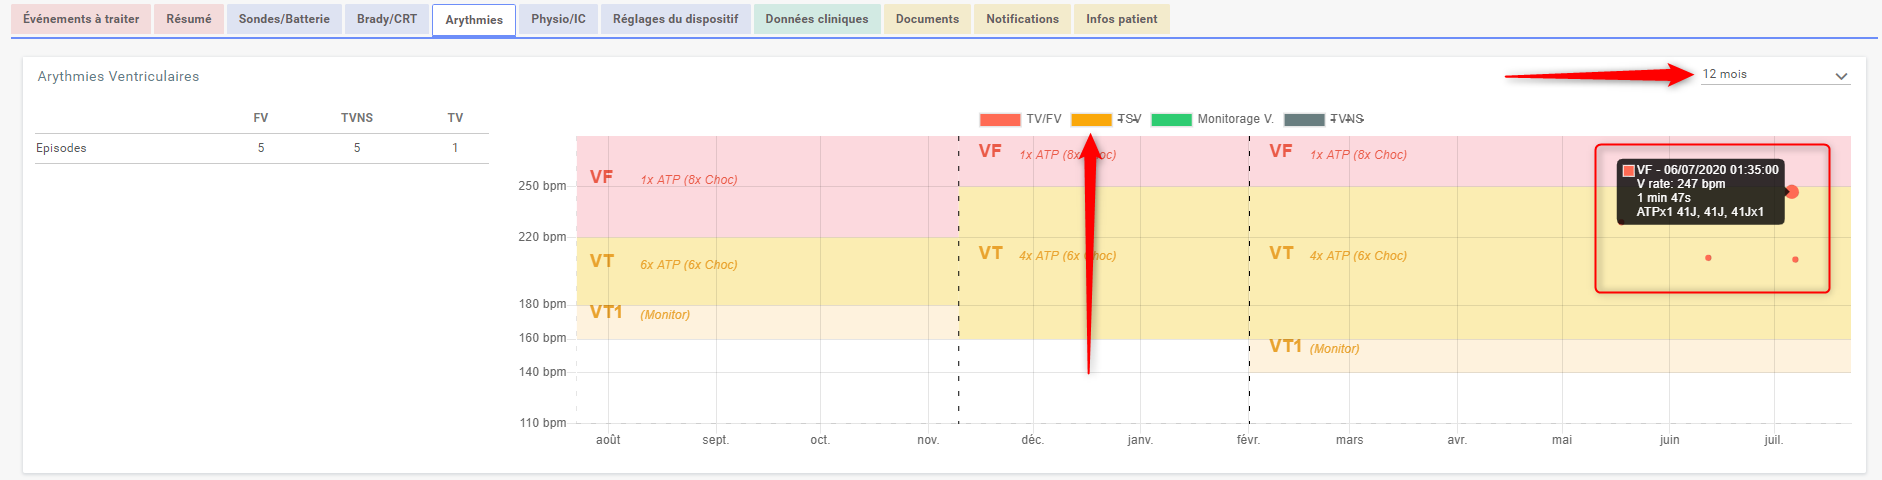
Note : by default the SVT episodes are not visible on the plot, you have to click on "SVT" to see them.
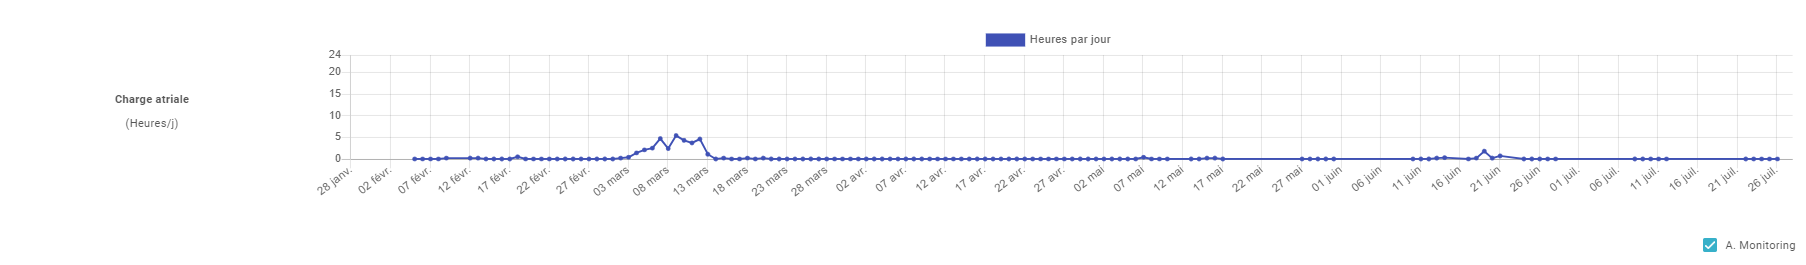
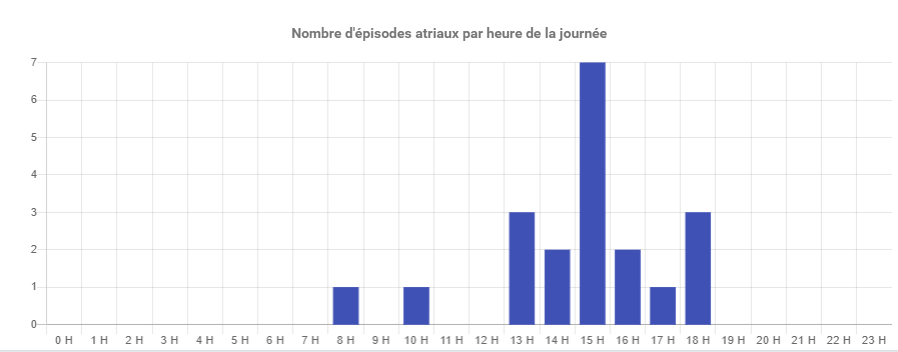
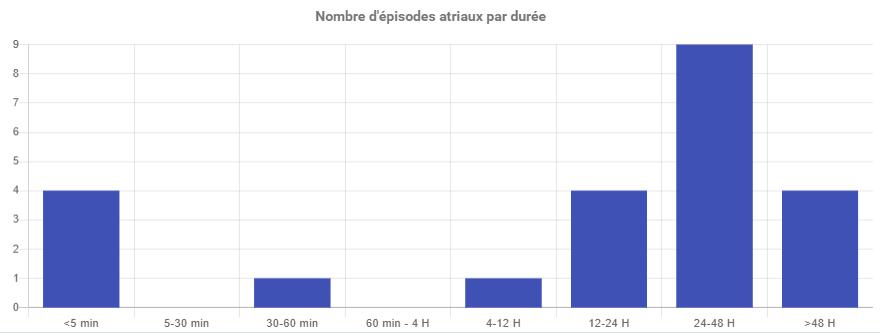
- Useful charts for an overview of the patients in AF:
- Chart showing the atrial activity over time
- Chart showing the atrial episodes per hour in a day
- Chart showing the atrial episodes per episode duration
Note : by default, the episodes classified as "Atrial monitoring" episodes are not included. You have to select the corresponding box to make it visible.
Episodes list
The complete list of the patient's arrhythmic episodes is available below. If the red shape icon is displayed, it means that the manufacturer sent us an EGM related to this episode.
You can :
- Choose to filter this list by episode type, or select the box to only focus on the episodes that lasted more than 20 seconds.
- Pin the significant arrhythmic episodes in order to easily find them on the list later. The pinning of an episode selects this episode by default for the patient reports.
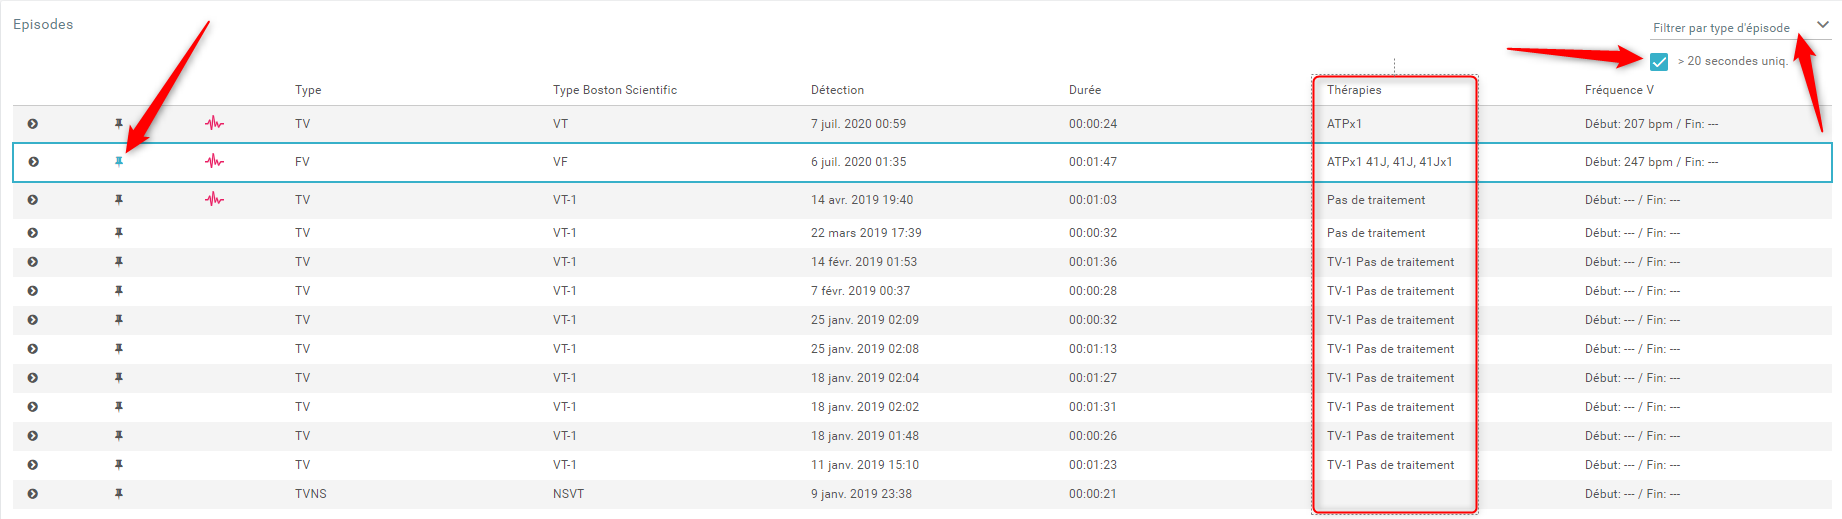
Note : the periodic EGMs of Biotronik are available in this section
- Access the EGM by clicking the small arrow on the left, so the episodes details will appear. If the EGM is not displayed, click on "see the PDF file"
Note : There are 30 episodes per page. A navigation bar is available at the bottom of the page to see the former episodes.